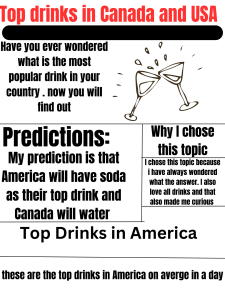
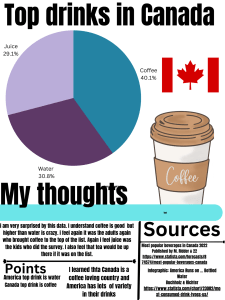
My topic was the top drinks in Canada and America. My goal with this topic was to find out this information because I was really curious and I’ve always wondered what was the answer. I used this website called Statista it was a very good website and had lots of information for my graphs. I created my infographic poster of canva. Canva was a very good website to create poster and slideshows its like PowerPoint. They are both easy to use and what I like about canva is they have templates you can get inspiration from. The process using this sites were very fun and interesting to do. Statista was a easy website to use but I had to scroll to find the best information. Canva was by far the best website I used because I could import picture easy and quickly. These websites helped me understand that technology can help the world. I’ve seen videos on this AI that can just hear someone voice and just made audio messages out of it. It was very scary but using these websites helped me realize that technology can be used for good and the future could be good.


