
Link to my infographic:
https://www.canva.com/design/DAFj4xI22T4/BP4hBvtkHFRx90vavtWfFQ/edit?utm_content=DAFj4xI22T4&utm_campaign=designshare&utm_medium=link2&utm_source=sharebutton
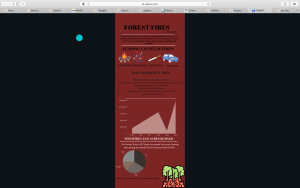
What is the overall topic and the goal of your project?
- My overall topic for this DL project was about forest fires. Forest fires are a big thing going on right now and I decided to spread the awarenesses on how much it has affected Canada and teach how to prevent it from spreading more.
- What sites did you use to collect your data and create the infographic and what did you learn about it? Here are the sites that I used for this project: https://www.doi.gov/blog/10-tips-prevent-wildfires, https://www2.gov.bc.ca/gov/content/safety/wildfire-status/about-bcws/wildfire-statistics/wildfire-averages, https://earthobservatory.nasa.gov/images/151313/fires-scorch-western-canada, https://www.statista.com/statistics/553557/number-of-forest-fires-in-canada-by-province-or-territory/
3. How has the process of utilizing these sites impacted your understanding of how technology can change (or help) the world?
Technology helped me a lot with finding true information with good sites as the ones I put in my edublog because these are all true information from CBC News or gov.bc.ca.